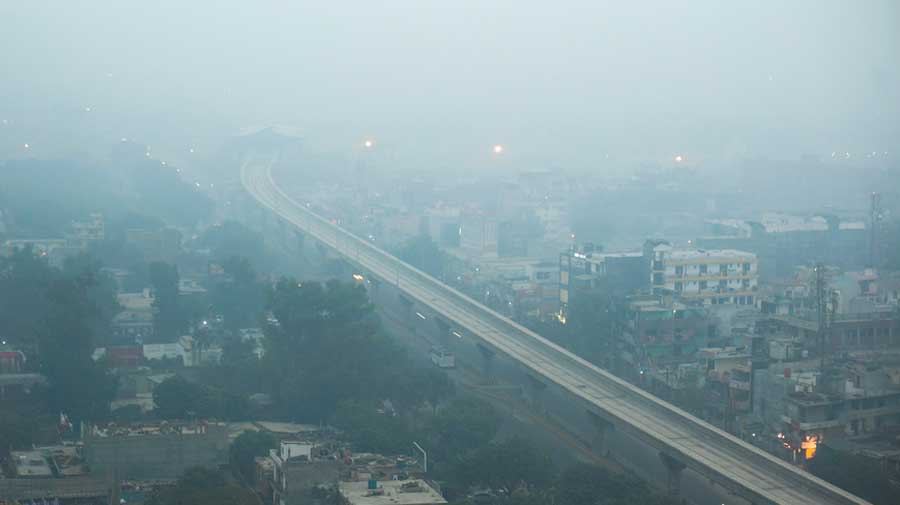
Calcutta, like Delhi, will soon start generating ward-wise air pollution data that will make it easier to manage local pollution, an air pollution expert from IIT Delhi said.
“Based on our suggestion, the pollution control board is setting up sensor-based air pollution measuring points all over the state. We expect to use the data generated by these sensors along with satellite data to find ward-wise pollution levels in the Calcutta metropolitan area and elsewhere,” said Sagnik De, from IIT Delhi that has conducted a study, at a meeting organised by Climate Trends.
“We have already placed an order for around 150 air pollution sensors. Initially, the sensors will be put up at all district headquarters, followed by all municipal cities,” Kalyan Rudra, the chairman of the PCB told Metro.
Rudra said the PCB was putting the sensors mostly in universities.
Though Calcutta metropolitan area — greater Calcutta, from Budge Budge to Kalyani — followed by the Asansol-Durgapur area are the most polluted, the whole of Bengal’s air quality remains above compliance levels annually, De said.
He said that despite increasing awareness and claimed actions, the PM 2.5 level, the most critical pollutant that can reach the deepest layers of the lungs and trigger a range of diseases, has increased significantly between 2010 and 2019 compared to the previous decade.
“If you compare the decadal map, you will find that during 2001-09, only the southern part of the state was polluted. The whole of the south and central Bengal surrounding Calcutta became acutely polluted during 2010-19,” De said.
The IIT data, accessed by Metro, shows that while the 2001 annual average PM 2.5 was 66.6 microgram per cubic meter of air in the state, it rose to 78.2 microgram in 2019, increasing exposure both in urban and rural areas of the state. The national annual limit is 40 micrograms.
The IIT study pointed out that increasing emission load over the years, rather than meteorological changes, has mainly been responsible for the rise in pollution. “Though a sizeable amount of the pollution must be locally generated from vehicles, industry or domestic sources, a part of it is expected to be coming from outside Bengal, say Bihar, Jharkhand or Bangladesh air shade,” De said.
A recent international study has shown that Bangladesh is the worlds most polluted country.
“Pollution is also coming from Nepal, states in the Northeast, the eastern ghats, besides the Indi-Gangetic plains,” said Abhijit Chatterjee, a scientist from Bose institute.


